The El Niño drought and heat suppress the capacity of the Amazon rainforest soil to absorb isoprene by a factor of four, while boosting its amount around the forest canopy.
During the 2023–2024 El Niño – the most severe drought ever recorded in the Amazon basin – tree emissions of sesquiterpenes surged. Unexpected emissions of sesquiterpene alcohols in the wet season after the drought, suggesting the forest’s stress-defense metabolism stays active long after the immediate stress has passed.
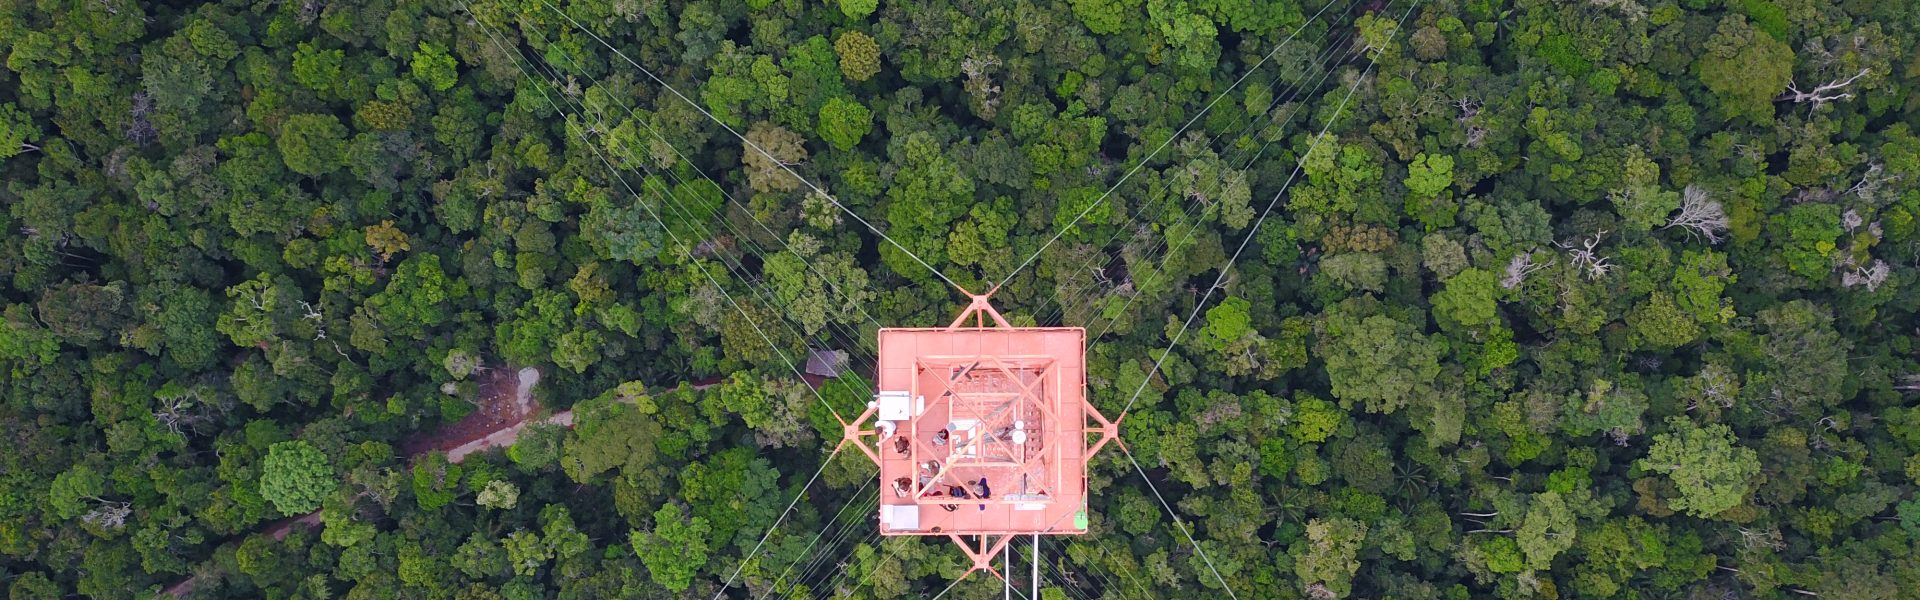
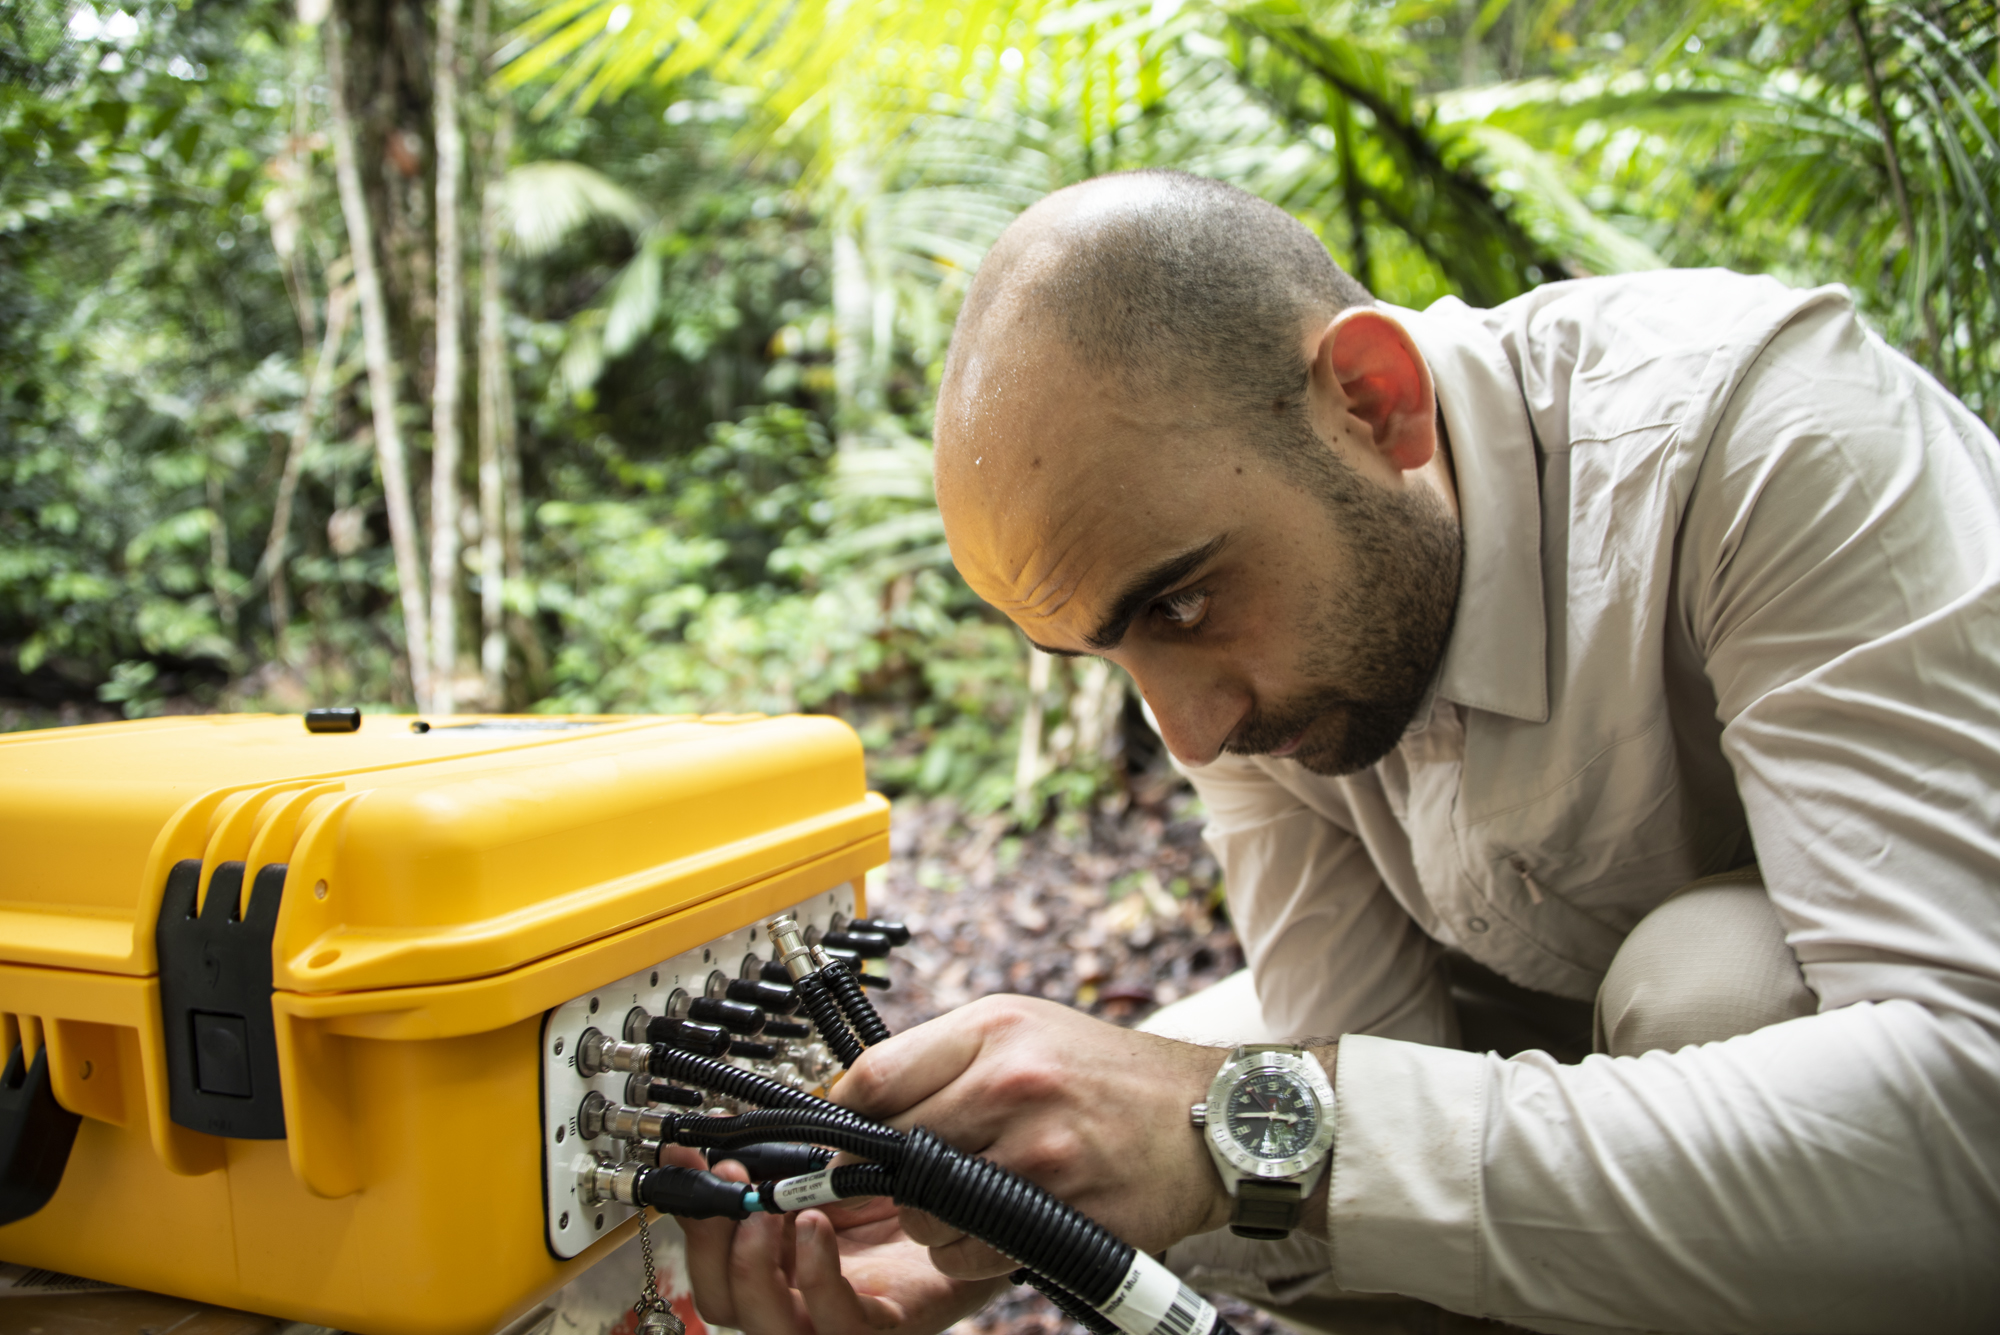
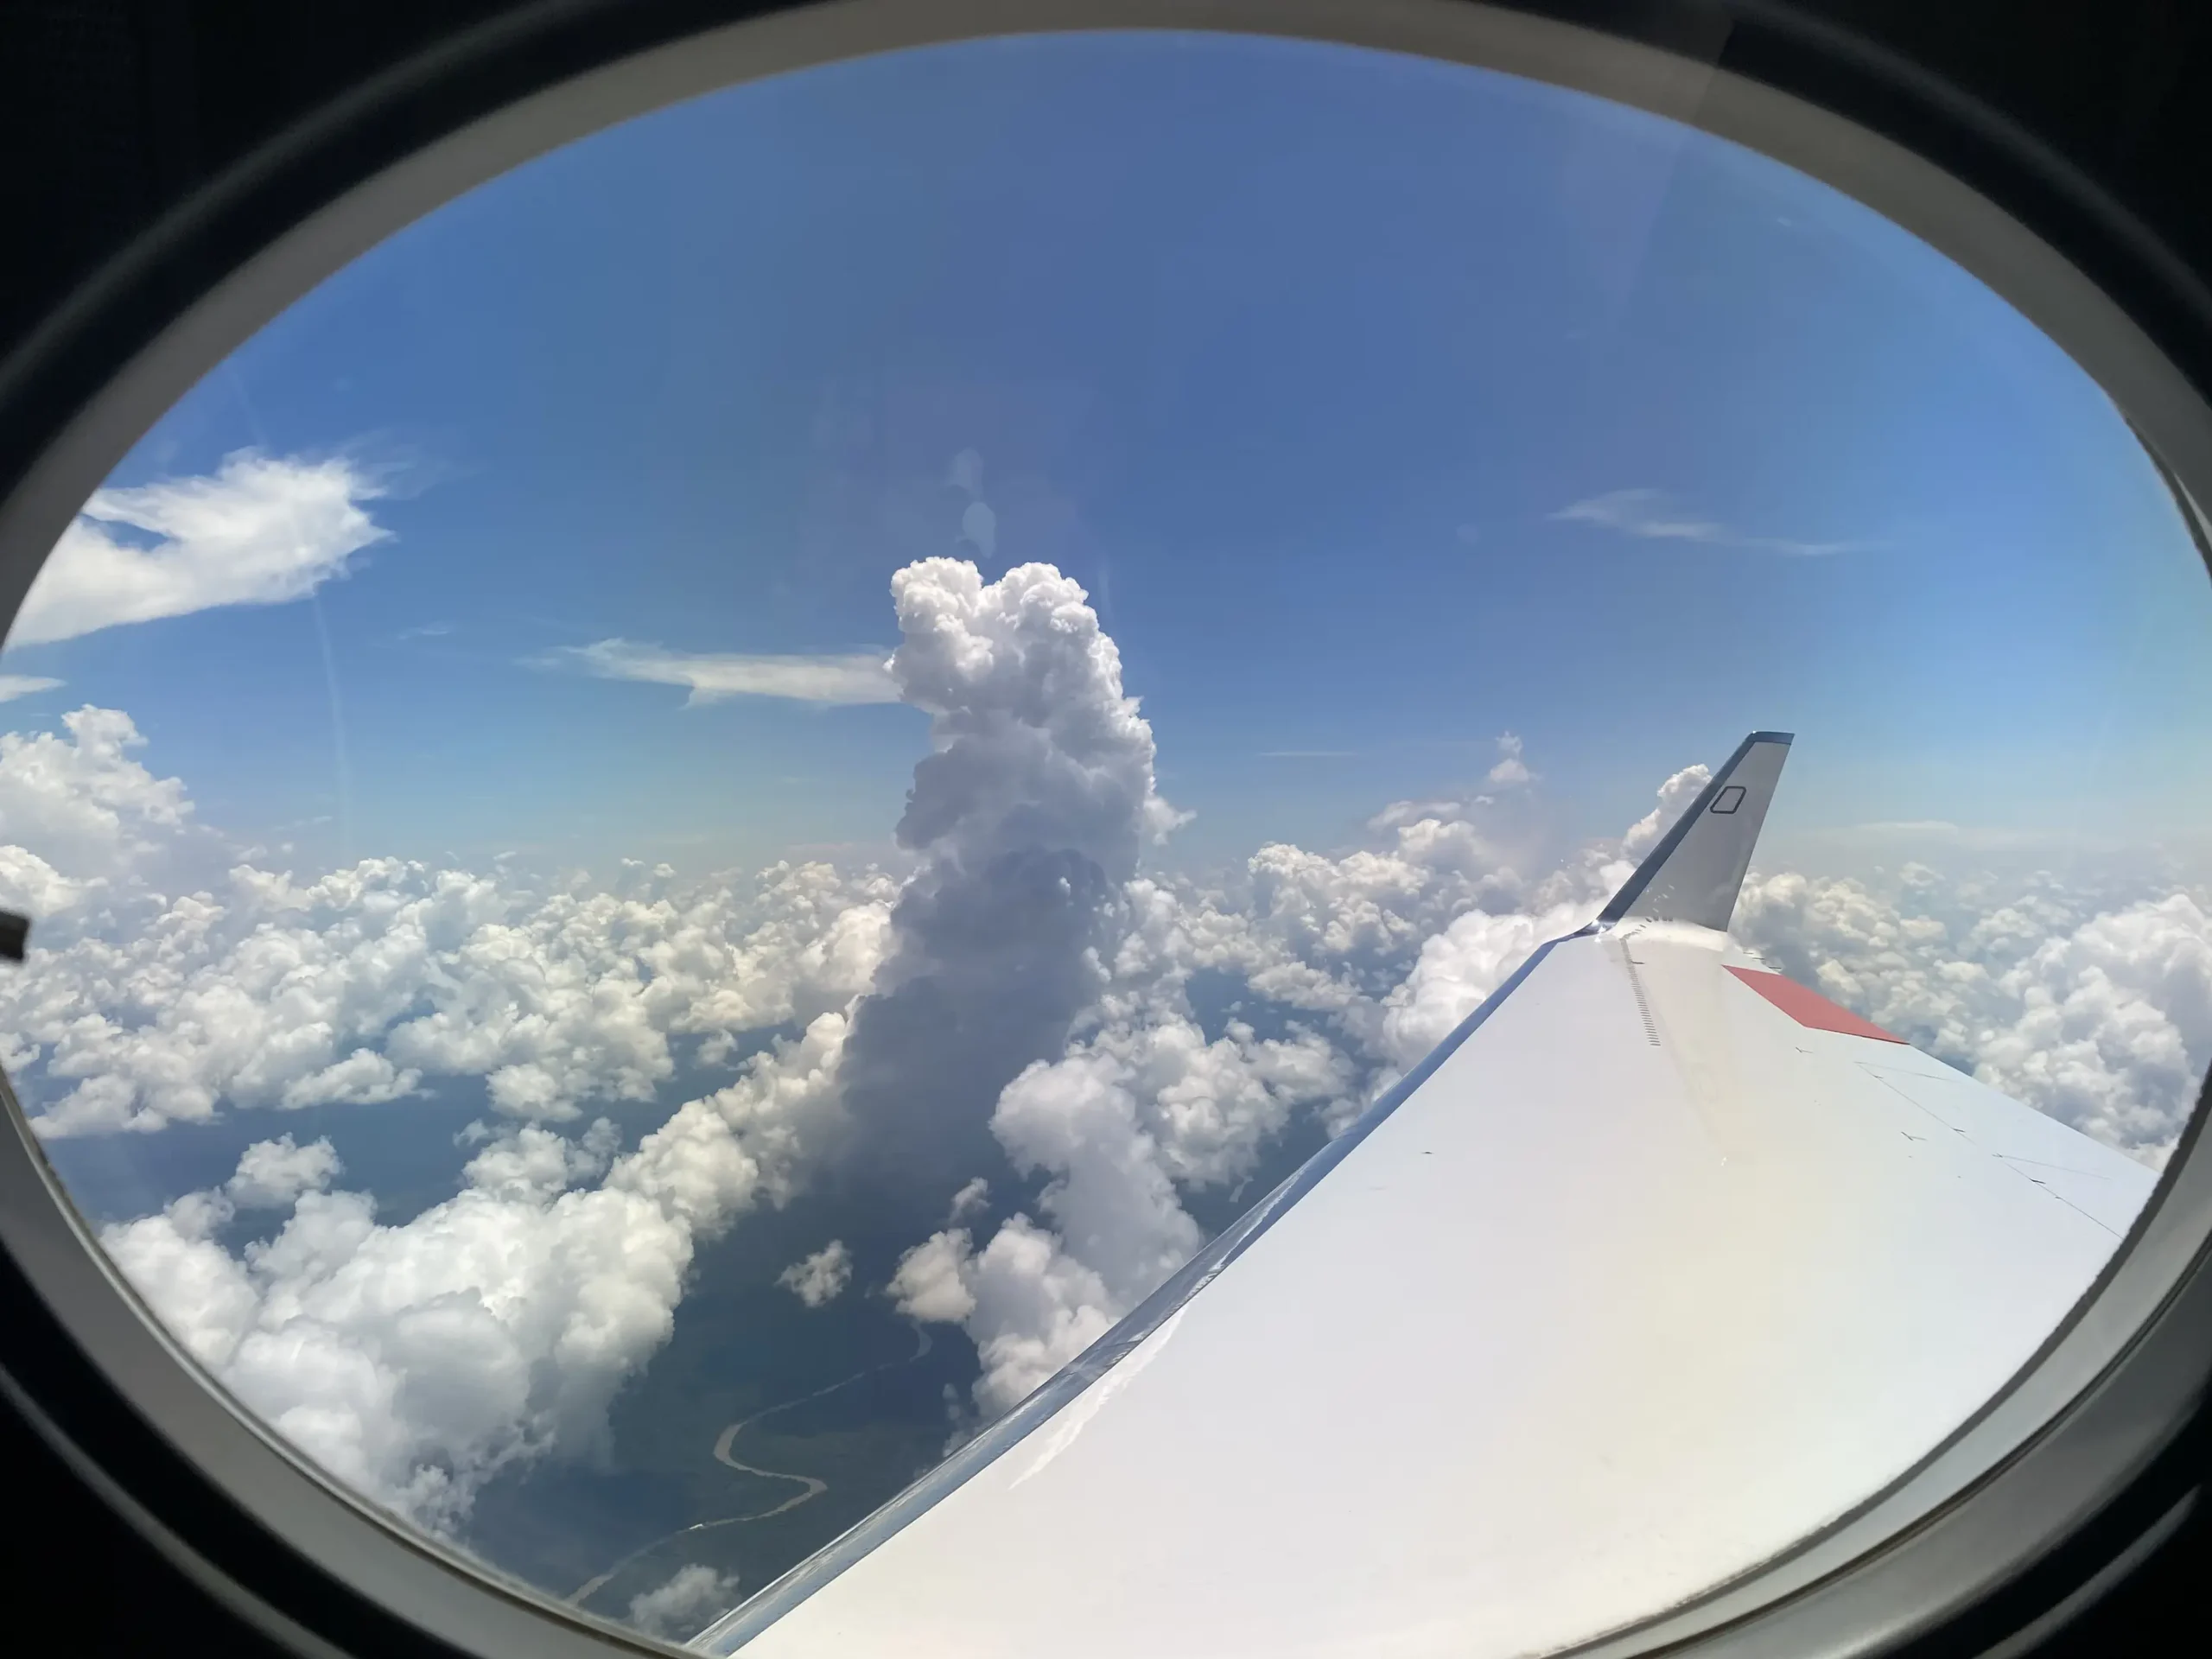
The CloudRoots project asks a simple but powerful question: How does the Amazon rainforest interact with its own clouds? CloudRoots explores this two-way dialogue between forest and atmosphere across scales ranging from tiny leaf pores to clouds several kilometers above the Amazon. The team published the results from their research in several papers.
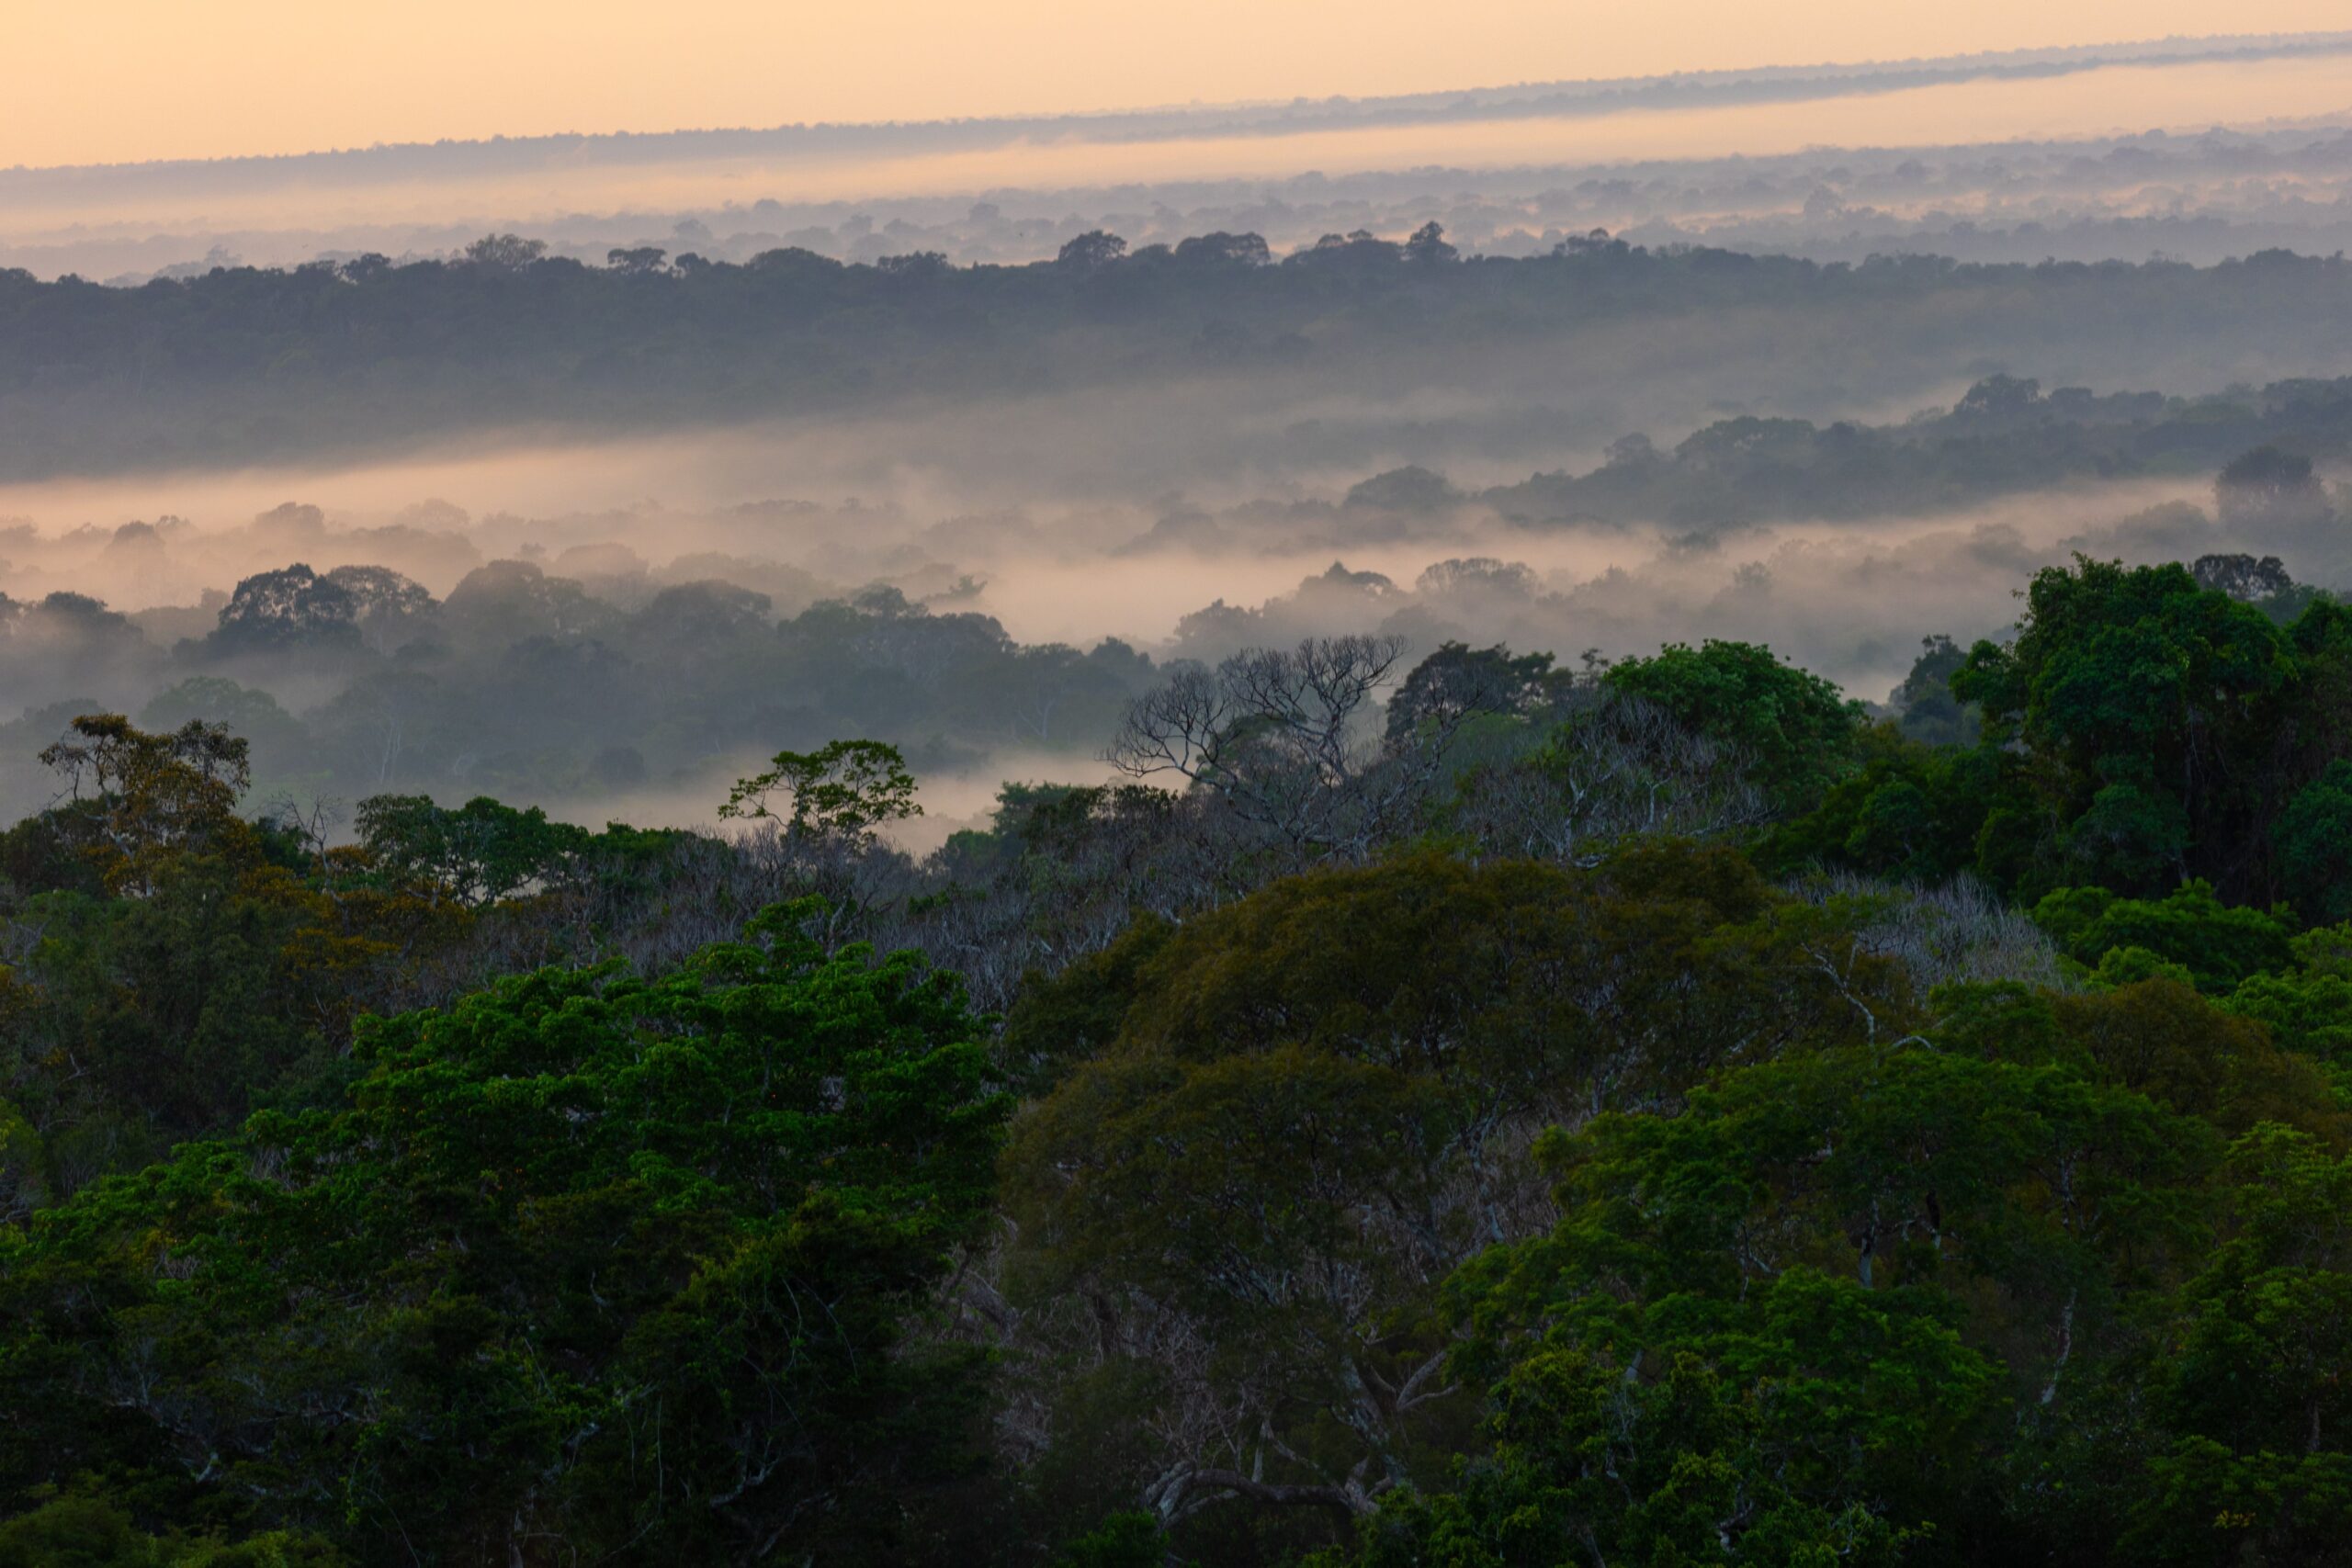
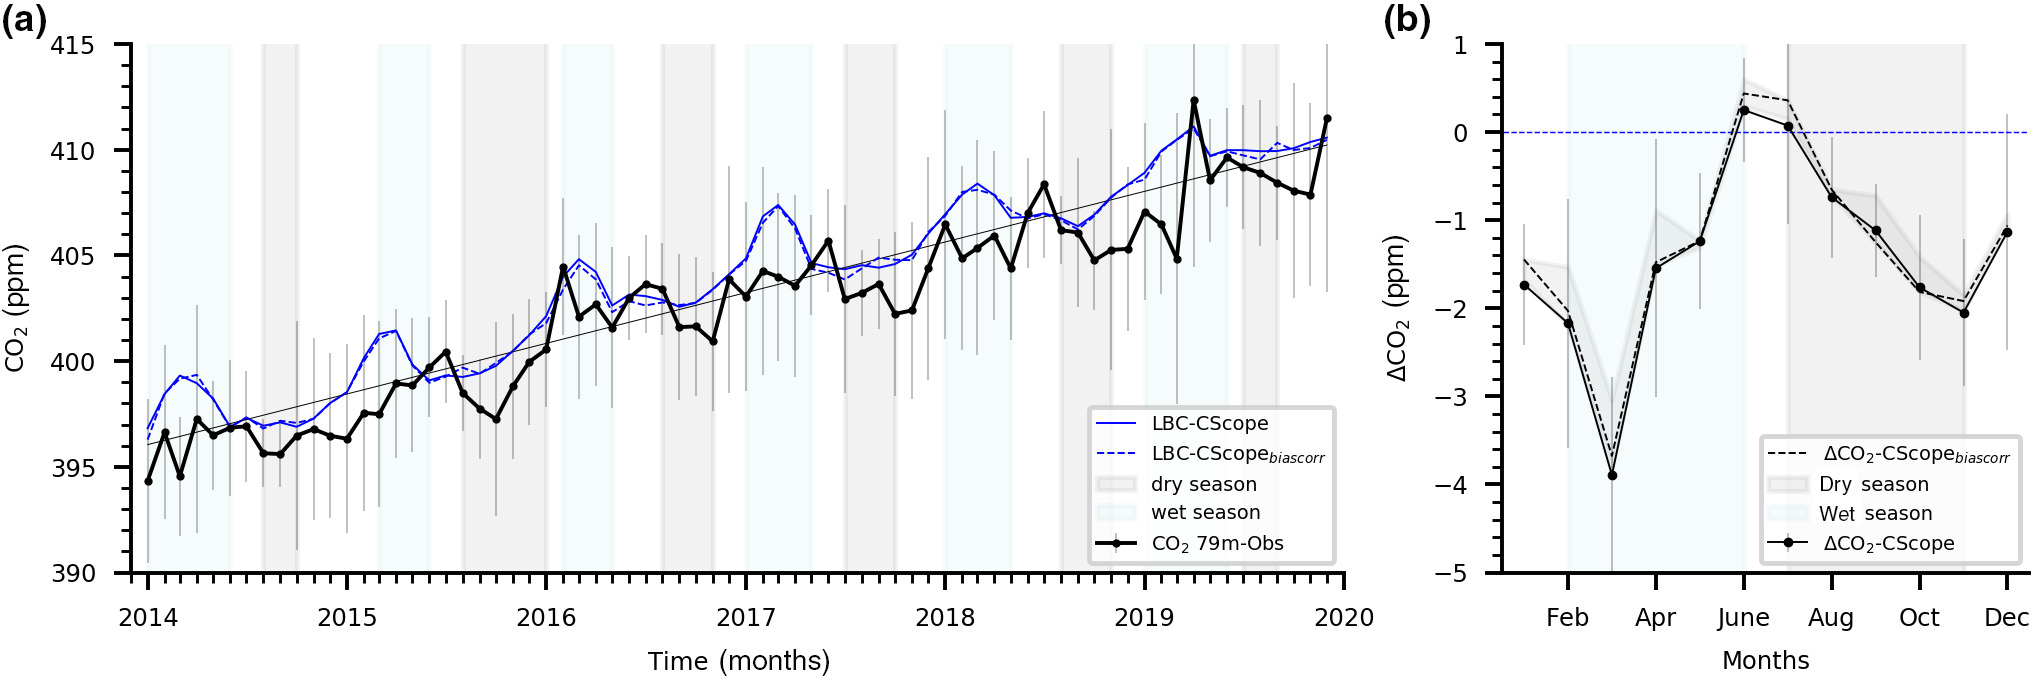
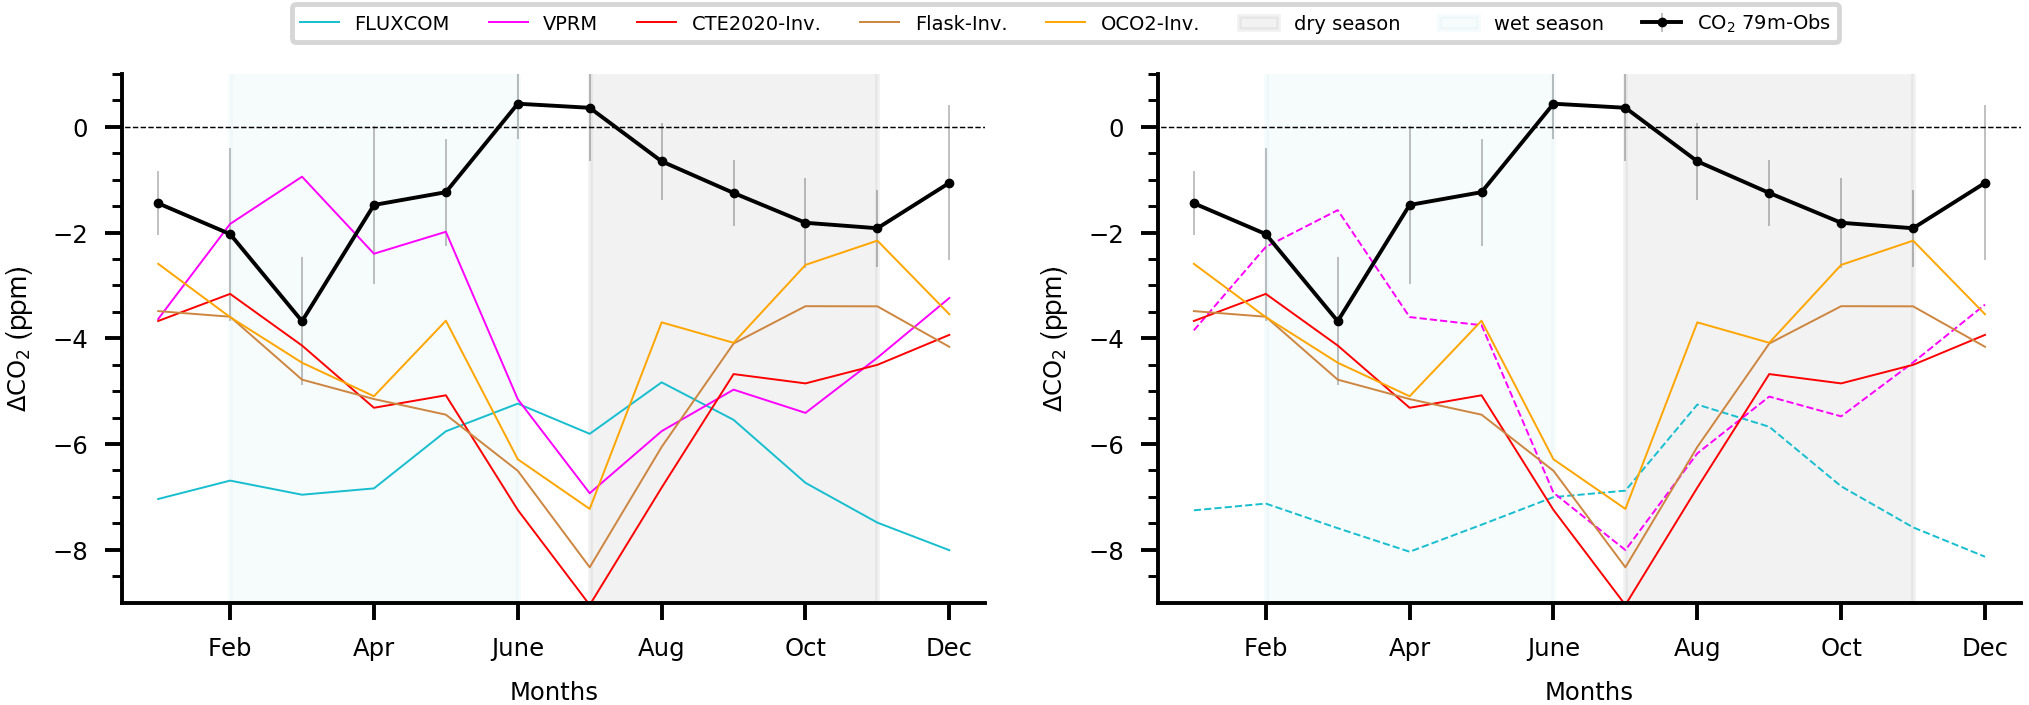
The Amazon rainforest experienced unusually high temperatures and atmospheric dryness in 2023. Observations from ATTO and further data revealed that the vegetation’s uptake of carbon was above average early in the year, but drastically reduced during the drought season, leading from a carbon sink into a source.
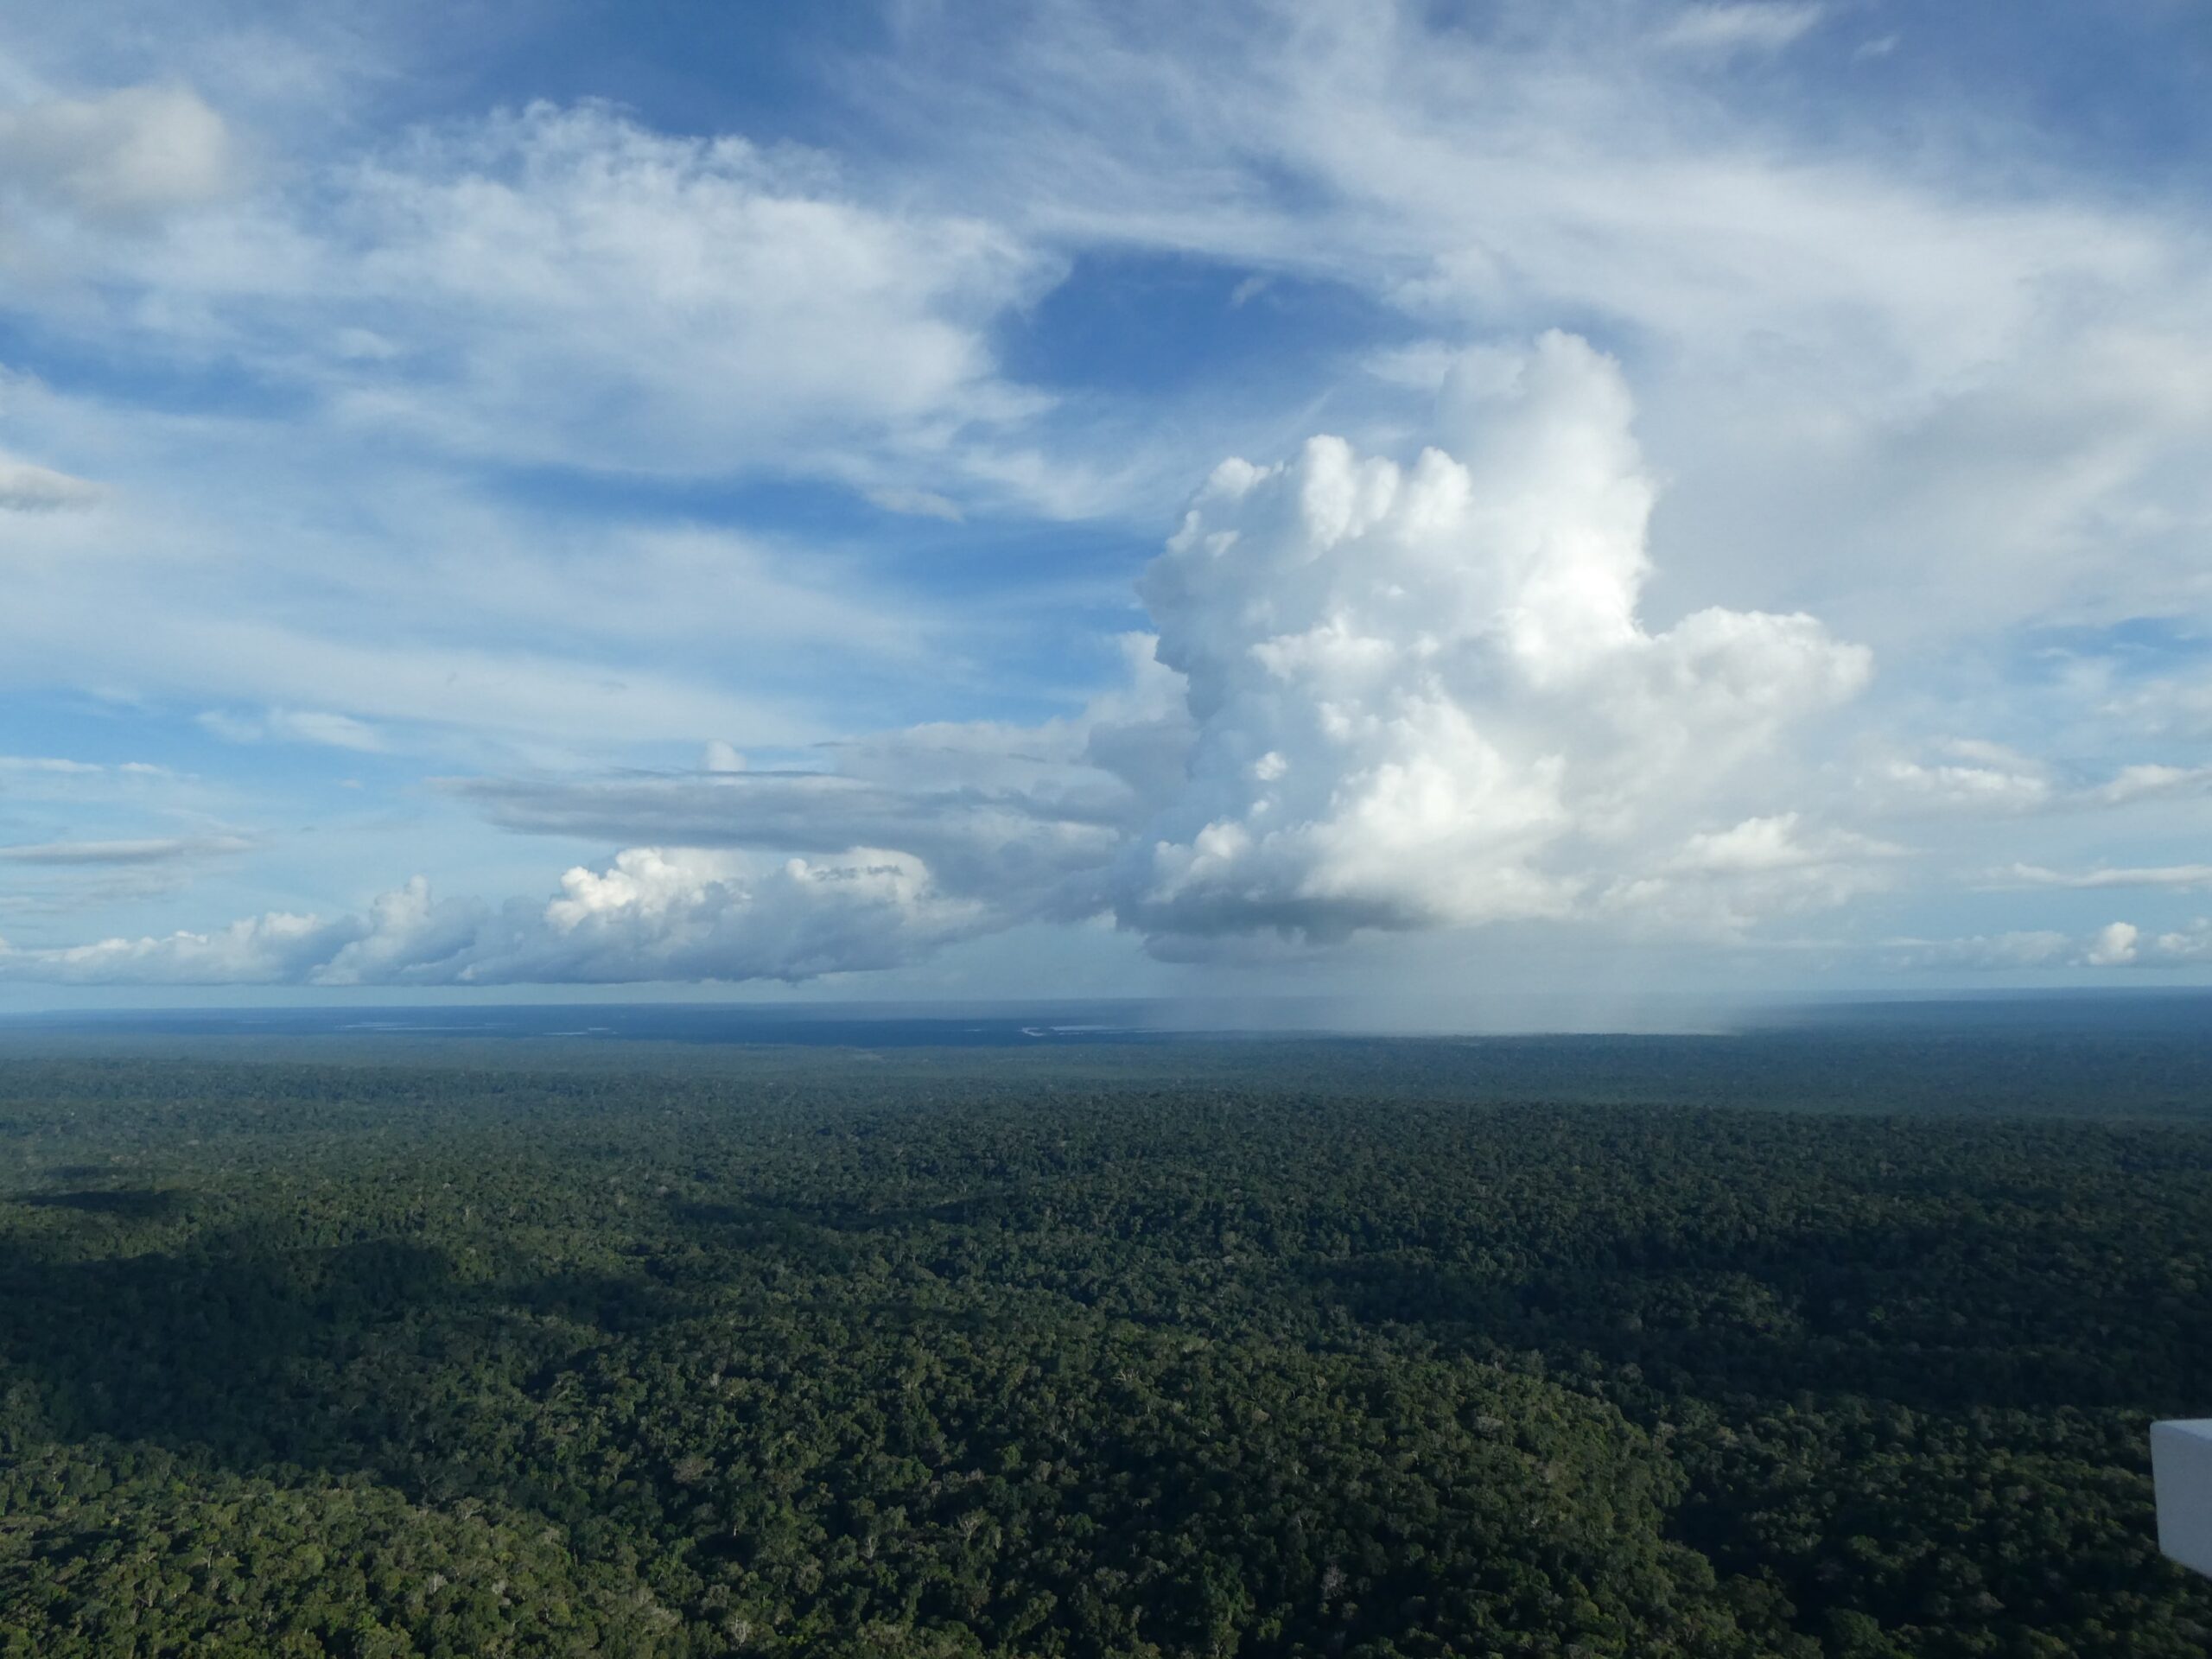
New study highlights Amazon’s critical role in the Earth’s climate system, revealing that land-use changes and accelerating deforestation reduce biogenic trace gas emissions and impact atmospheric chemistry up to 12 km altitude.

Direct measurements of OH radicals are rare and difficult to achieve. However, since they react with BVOCs, Ringsdorf et al. inferred them from isoprene measurements at ATTO. To do so, they applied a technique called ‘Dynamical Time Warping’ from the field of speech recognition. Akima Ringsdorf et al. published the study “Inferring the diurnal variability of OH radical concentrations over the Amazon from BVOC measurements” Open Access in Nature Scientific Reports.
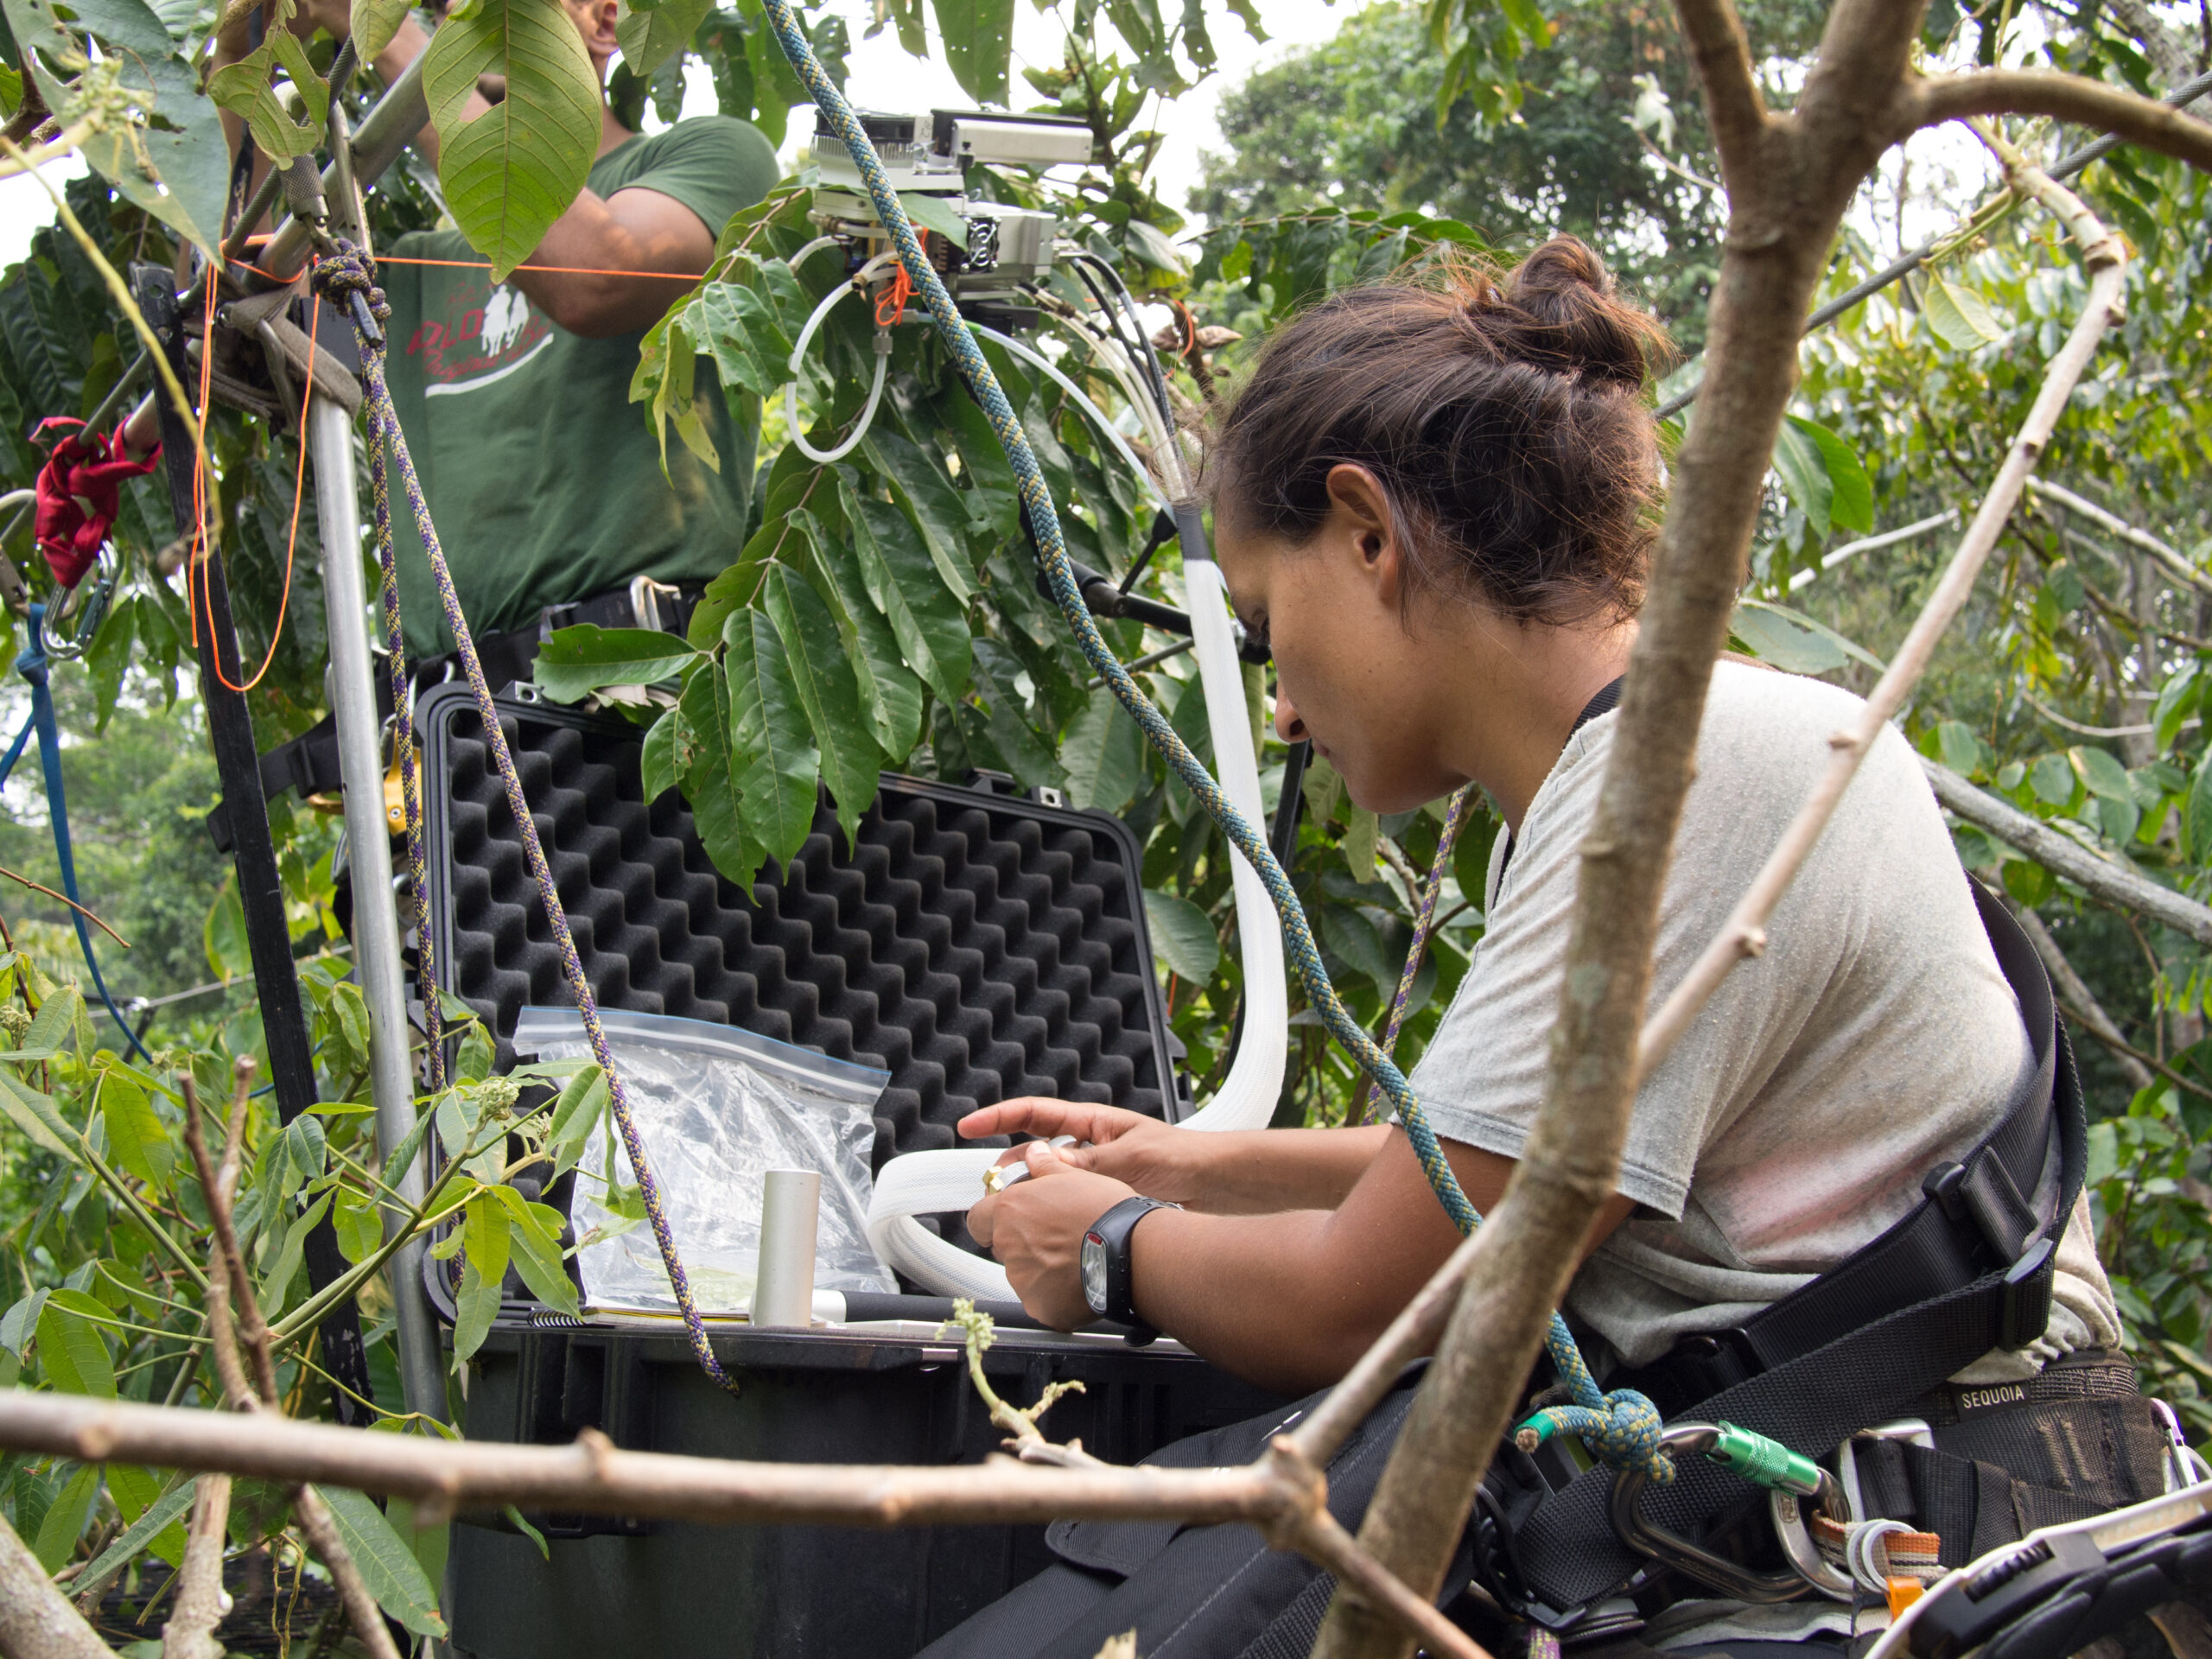
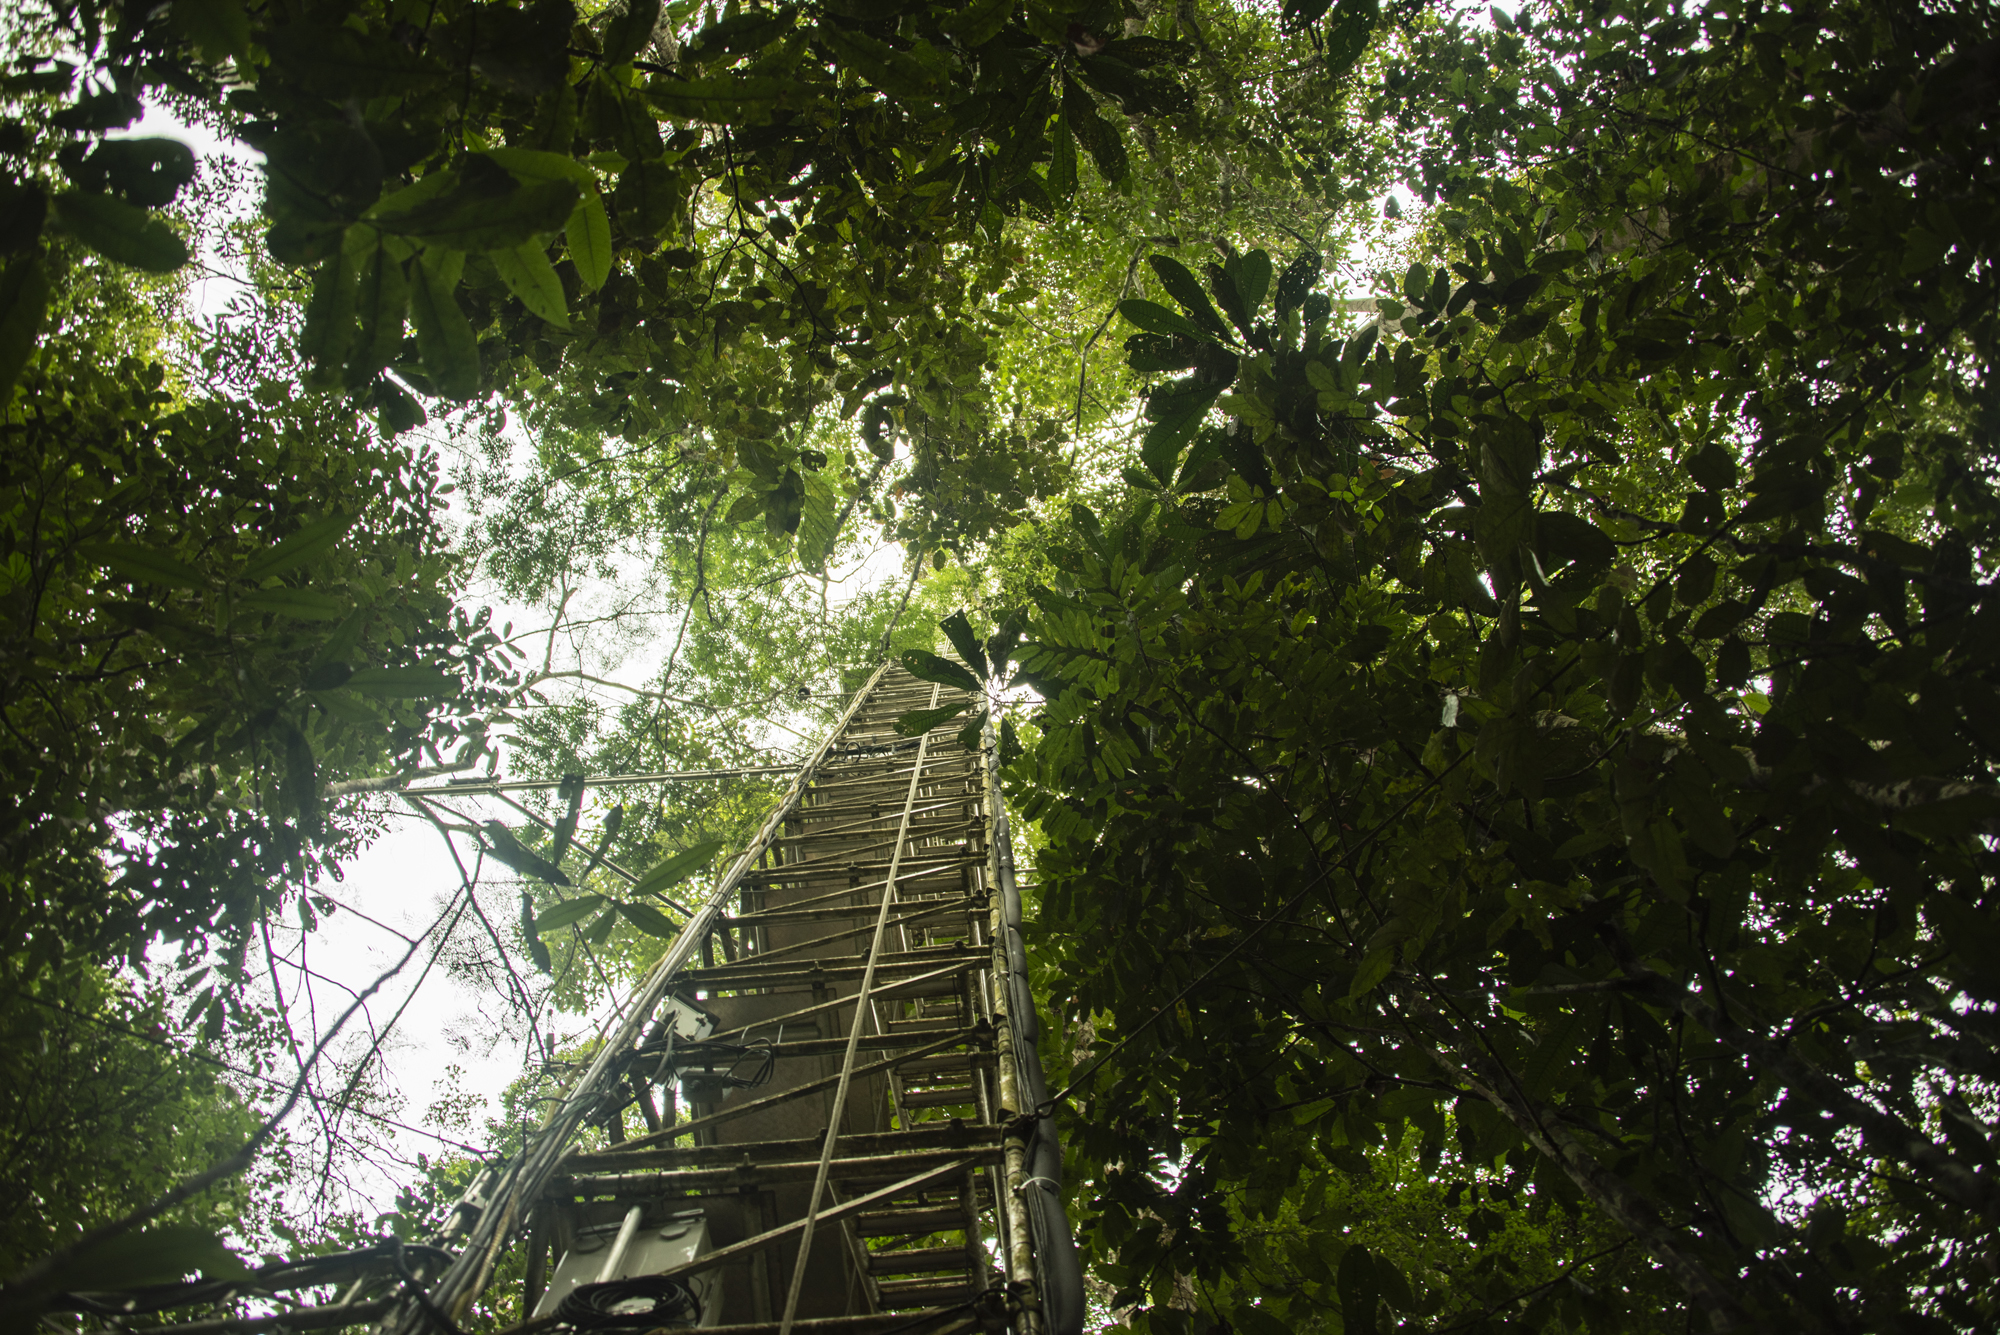
Eliane Gomes Alves and her colleagues measured isoprene emissions at the ATTO 80-meter tower across three years to better understand how these emissions vary seasonally and under extreme climatic conditions like El Niño events. They also looked into which biological and environmental factors regulate the emission of isoprene to the atmosphere.
Ramsay et al. developed a new model to assess nitrogen exchange between atmosphere and biosphere based on observations at ATTO. This model includes parameters controlling both nitrogen deposition and emissions in tropical forests.
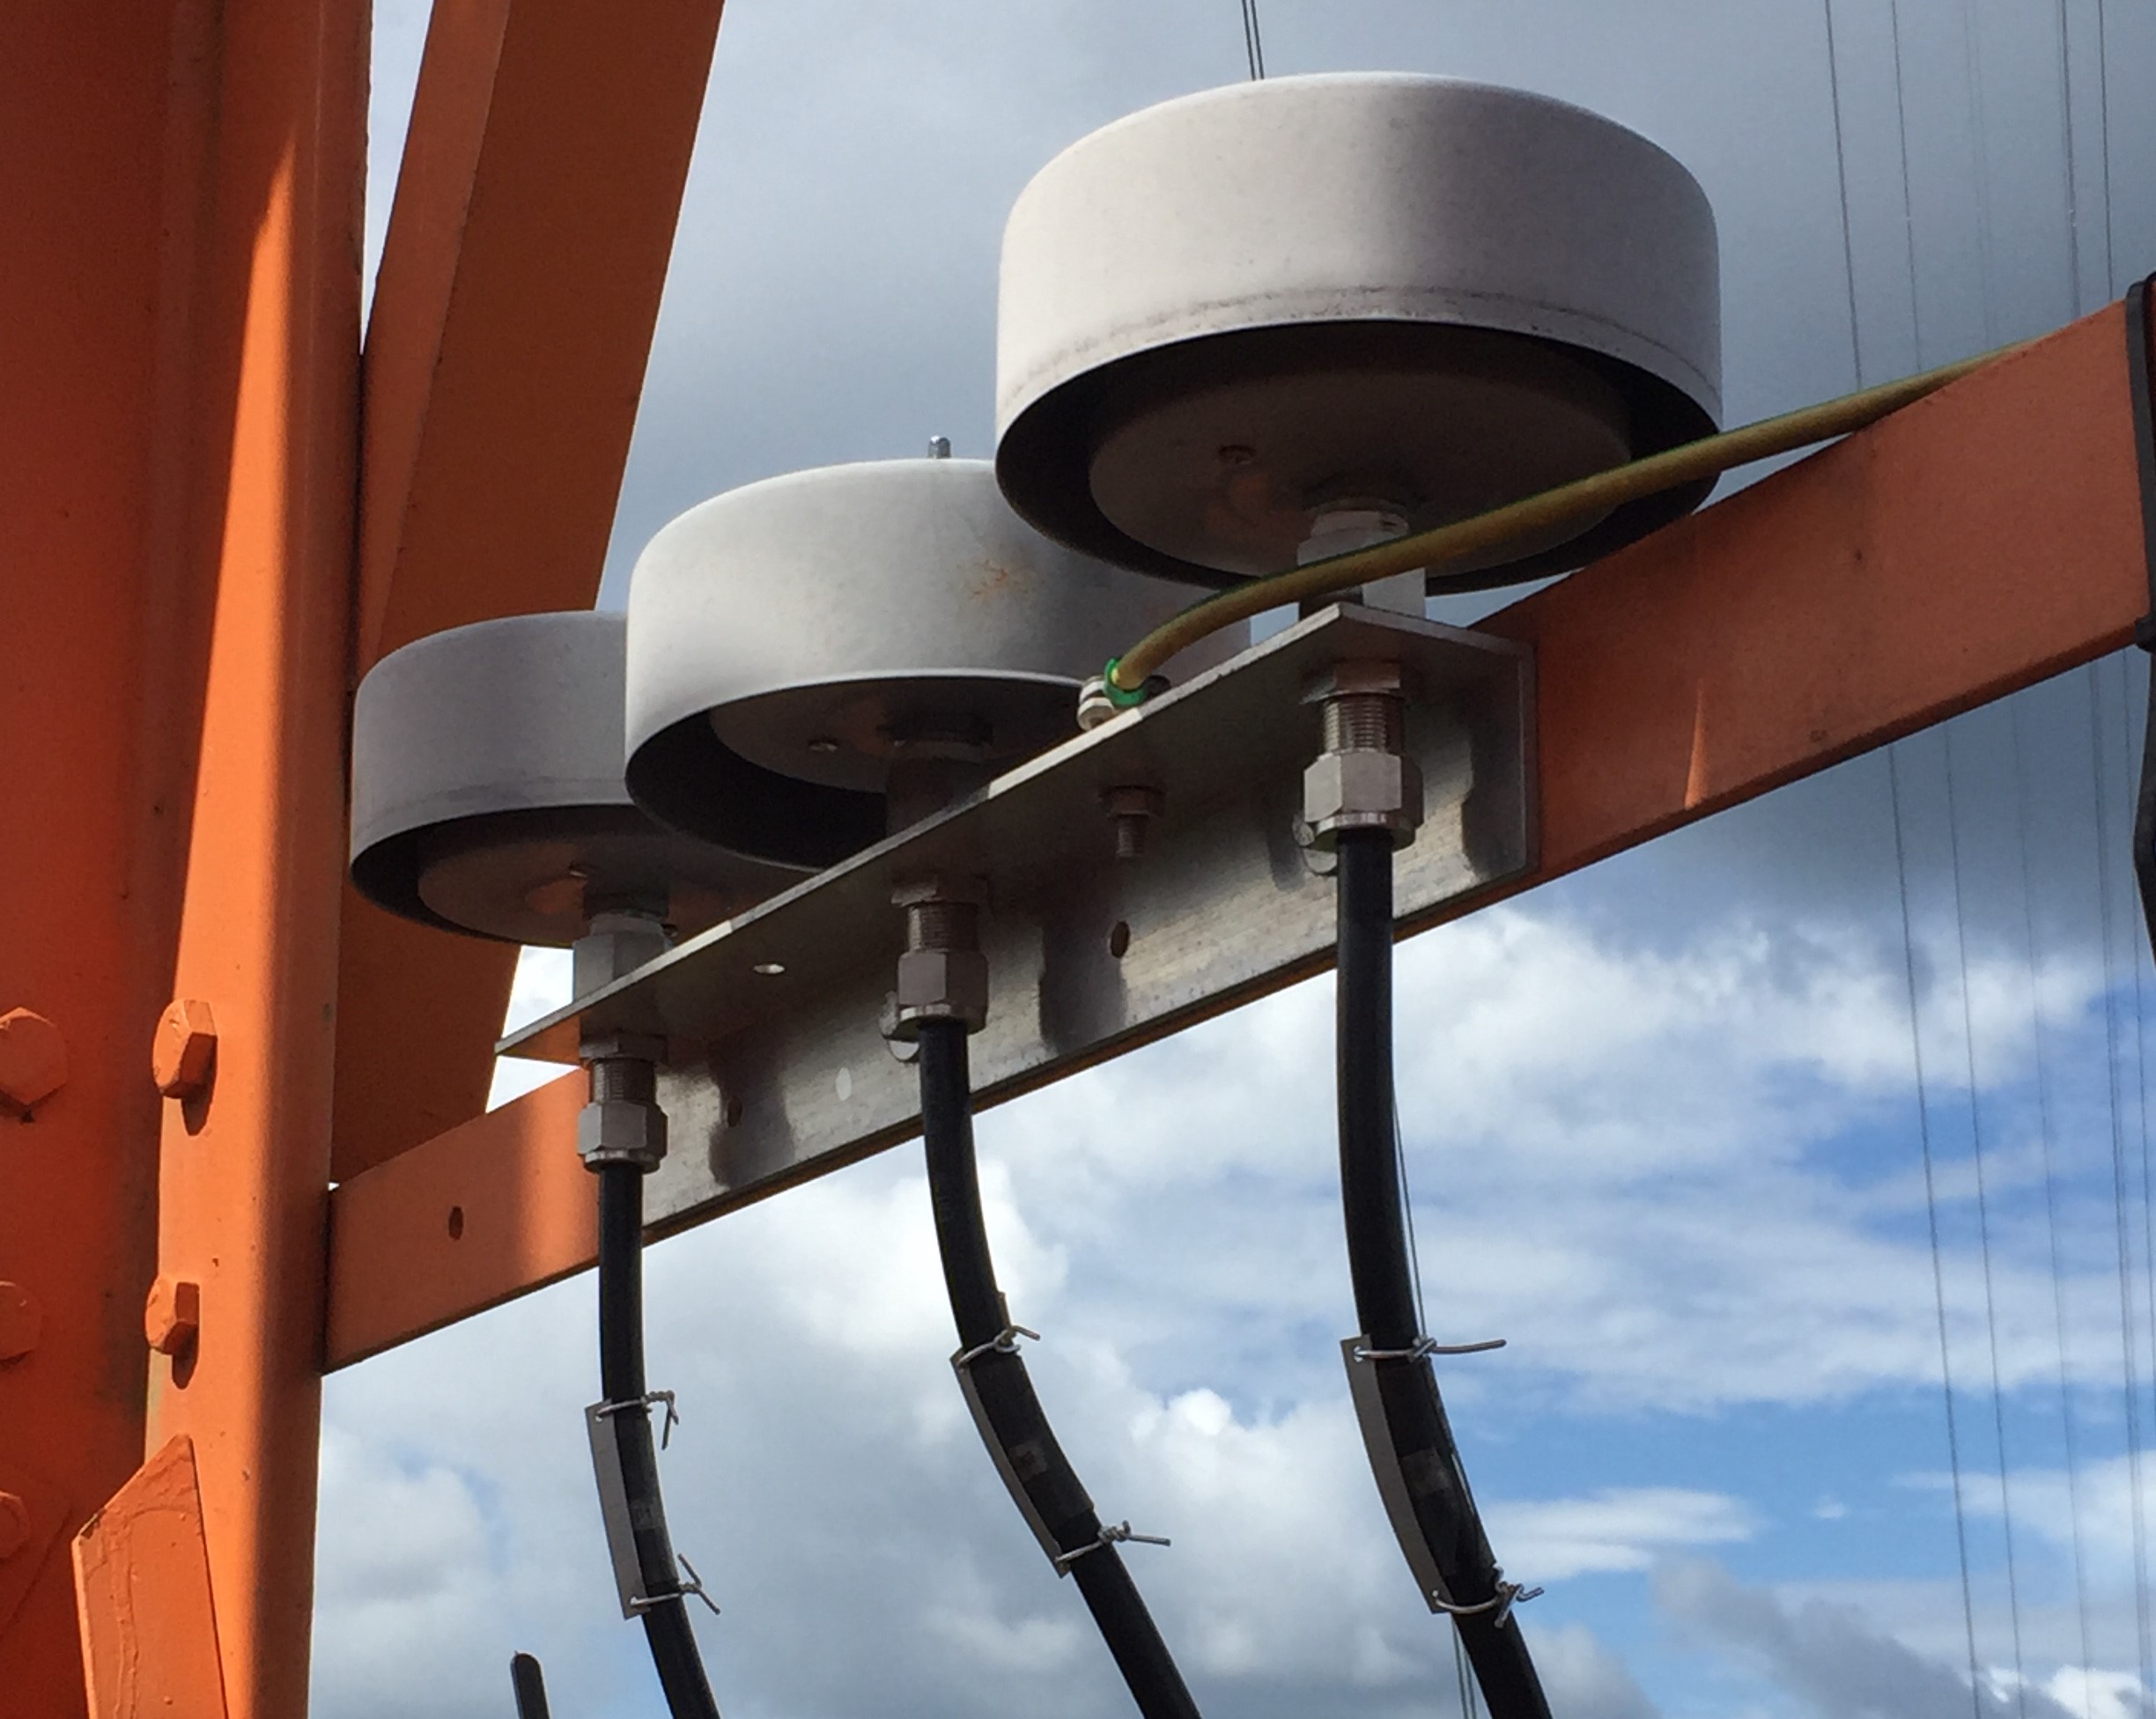
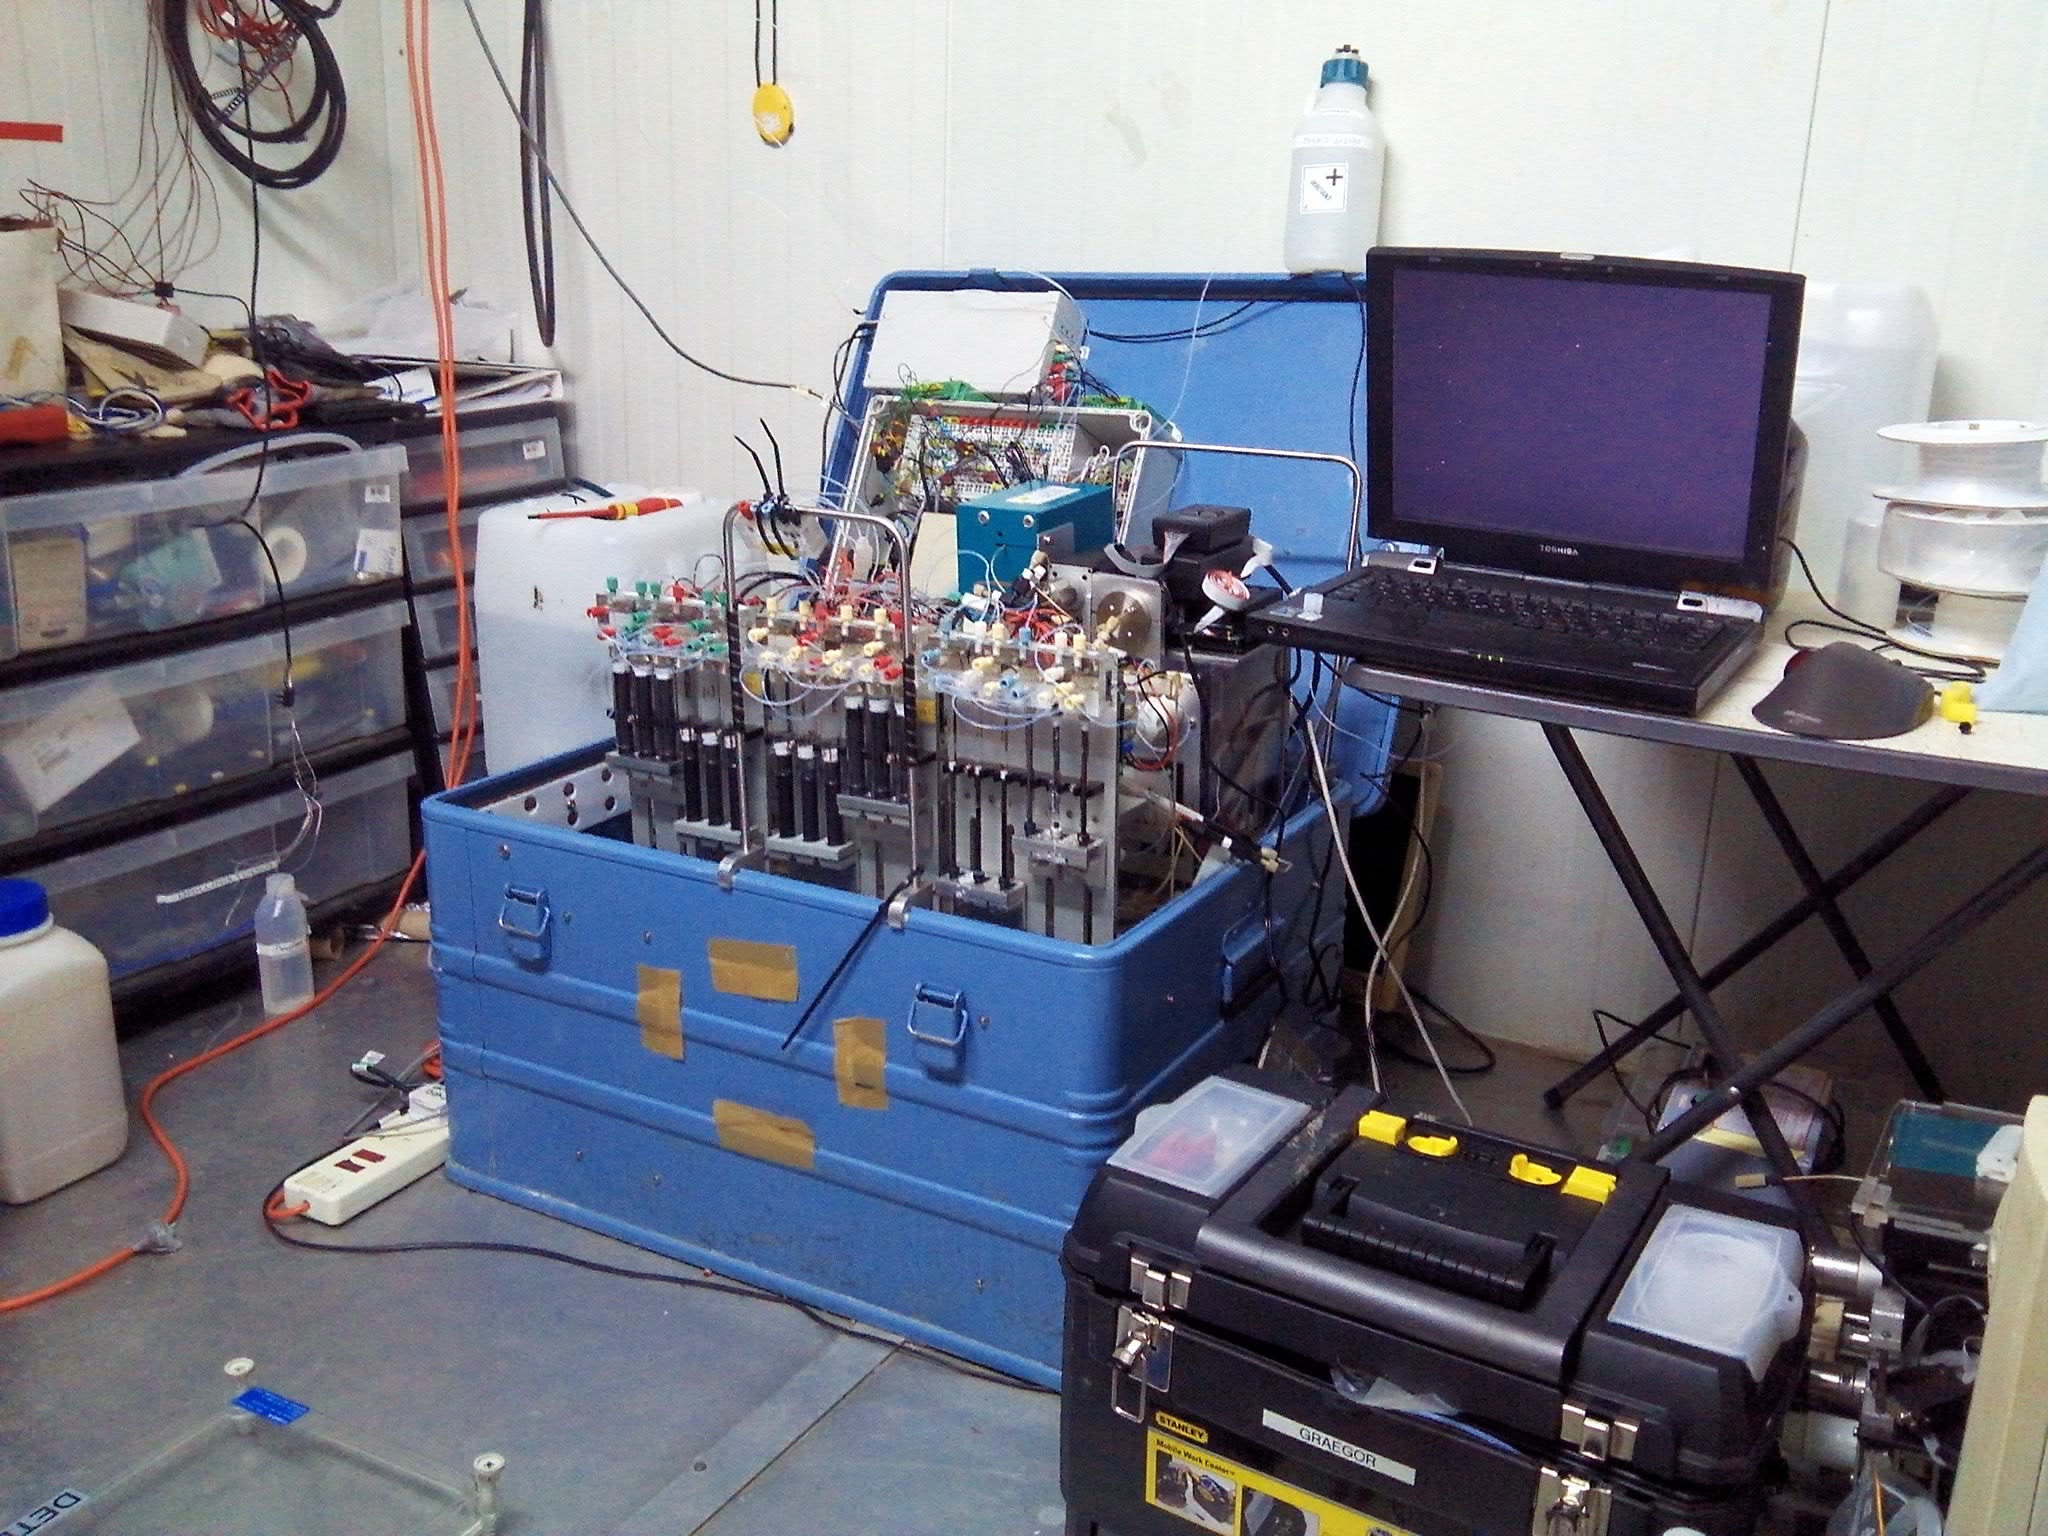
Ramsay et al. measured inorganic trace gases such as ammonia and nitric acid and aerosols in the dry season at ATTO. They are to serve as baseline values for their concentration and fluxes in the atmosphere and are a first step in deciphering exchange processes of inorganic trace gases between the Amazon rainforest and the atmosphere.

Pfannerstill et al. compared VOC emissions at ATTO between a normal year and one characterized by a strong El Nino with severe droughts in the Amazon. The did not find large differences, except in the time of day that the plants release the VOCs. They published their results in the journal Frontiers in Forest and Global Change.